
Introduction
Some time ago, I began a fruitless search for a detailed treatment of the performance losses endemic to roof prisms, and the so-called “phase coatings” that rectify the problem. Optics manufacturers tout the advantages of their proprietary coatings, but provide few specifics regarding the effect that their technology solves, or how their solution works. Moreover, I could find no literature review, or comprehensive papers or textbook chapters, which pulled together all the threads on this complex subject. So I worked through the details on my own. Being a physicist, I found all this quite recreational, and my technical write-up can be found here.
That article assumes familiarity with calculus-based physics. It is a bit on the long side at 35 pages, but this was necessary so as to fully explore the problem and various approaches to a solution. My paper lays out the origins of the phase shifts from basic electromagnetic theory, works through a lengthy diffraction pattern calculation in order to demonstrate how the resolution is degraded, and finally shows how the addition of one or more dielectric layers can help mitigate the effect.
Realizing that not everyone shares my enthusiasm for the mathematics, I also set myself the task of creating a parallel account that is less technical, without skimping on too much detail or worst of all, offering facile explanations. I have had to rely on diagrams and animations, which I hope will be useful.
An example of a facile explanation might be something like the following: “When light passes through a roof prism, it acquires phase shifts which degrade the image quality, unless a special ‘phase coating’ is applied to compensate for it.” There is nothing incorrect in such a summary, but the curious individual will have many questions in response. “What are these phase shifts? Why do they occur? In what sense is the image affected? Why does this affect roof prisms, but not Porro prisms? How can the effect be eliminated or reduced? What exactly does a phase coating do?” And so on.
Since this is not a simple topic, it is best to break it up into multiple posts. In this first part, we will survey the landscape and then focus on the matter of the phase shifts: what they are and why they must occur. The second post will trace the passage of light through a roof prism to show how these shifts accumulate and lead to destructive interference. The third part will give an overview of the resolution loss, and will introduce phase coatings that help to fix the problem.
An overview of the problem
Binoculars are a pair of aligned refracting telescopes, and as such, must meet various requirements to ensure quality performance. A sizeable field of view, adequate magnification, and comfortable eye relief are all critical features. Happily, each of these can be had by optimizing the classic Keplerian design, which uses a pair of positive lens groupings. A simplified schematic of this approach is shown in Figure 1. The telescope consists of a larger objective element and a smaller eyepiece placed behind it and along the same optical axis. Both objective and eyepiece consist of multiple lenses in order to mitigate effects such as chromatic aberration; we will not be concerned with any of that here. What is important is that both sets of optics together form an afocal system in which parallel light rays (shown in color) are collected and redirected so as to produce a magnified image.
Tracing through the ray diagram, we note that relative orientations of the different rays get flipped. Hence, we pay a steep price for Kepler’s simple and elegant approach, for the image will be upside-down and left-right reversed. Adding more lenses can correct for this, but this results in a much longer device, like the archaic mariner’s spyglass, something not amenable for compact binoculars.
A more practical solution is to use a series of reflections to fold and flip the light, undoing the reversal endemic to this lens system. When we think of reflection we typically think of mirrors, but in an optical system it is far preferable to use the inside surfaces of a glass prism in which the light undergoes total internal reflection (TIR). In that case, none of the light’s energy is lost. This is not the case for even the best mirrors, which cannot reflect with 100% efficiency.
To get both up-down and left-right correction, we can use a Porro prism, as shown in Figure 2. This device uses two glass blocks arranged so as to reflect from four inner surfaces. We use colored rays to show that both a left-right and up-down reversal takes place. By placing such a device between the objective and eyepiece elements in a telescope, we can produce a correctly oriented image. But this geometry also acts to shift the optical path sideways, resulting in the iconic binocular Z-shape. This makes for a bulkier device, and one that is not well-suited for a sealed housing.

Certain types of roof prism can do the same work as the Porro but without displacing the overall light path. It is a neat trick, requiring a more sophisticated geometry. Central to the operation is a right-angle junction of two reflecting surfaces, oriented so as to face the light path at an acute angle. These surfaces give the prism a “peaked” appearance; hence the name “roof”. Figure 4 shows a simple example, the Amici prism, which is effectively a right-angle prism with the roof built on the longest side. An incident bundle of light will become split in a way that does not occur with the Porro: half of it strikes one side of the roof, then the second, while the other half of the light is reflected in the opposite order. The end result is a reversal of the light in a direction perpendicular to the roof line. This is all easier to grasp from the diagram than from a description.

The Amici isn’t enough to do everything we need. It might shift the image left-to-right, but it will still be upside-down. Other reflections must be employed to get another flip, and to put the beam back on track. There are several ways to do this, such as with the Schmidt-Pechan (S-P) design, which is shown in Figure 5. The S-P device is actually two prisms with an air gap between them. The Schmidt portion includes the roof prism, with the roof line orientated at an angle of 22.5 degrees relative to the optical axis, and the lower surface at 45 degrees. The second prism includes surfaces at these same angles, the lower of which is too shallow for TIR and which requires a multilayer dielectric “mirror” coating as a consequence.
Every “straight-through” binocular body holds a clever device such as this (or the Abbe-König (A-K) prism, shown below in Figure 6) between the objective lens and eyepiece, undoing the reversal of the Keplerian telescope and a giving the instrument a streamlined shape amenable to waterproof sealing and the filling with a dry gas to prevent condensation. But there is always a catch.
Each prism must be made to exacting standards, as even a slight misalignment of the surfaces will wreck the performance in the form of image doubling. It is a precision instrument and priced accordingly. But even for a perfectly machined prism, an insidious complication is yet lurking: the reflections from the roof structure acquire phase shifts which conspire to degrade the resolution, or in some cases cause a similar kind of image doubling. It behooves us to understand the origin of these phase shifts before we do anything else. And we can do that by thinking about some general properties of waves, even with something a simple as a vibrating string.
Reflected and transmitted waves
Physicists spend a lot of time thinking about waves moving along strings. It is helpful for visualizing related, but more complicated wave phenomenon, and aids in developing intuition about wave motion in general. Since light consists of transverse waves in the electric and magnetic field, the details of how it behaves upon striking the surface of a prism will have similarities to the motion of a vibrating string. This is a good way to begin thinking about reflection.
We first consider a string tied to a fixed point on a wall, and imagine flicking the other end up quickly, causing a pulse that races down its length until it reaches a hard stop, as shown in Figure 7. The force of the string pushing up on the wall must provoke and equal and opposite downward force, so the reflected pulse that comes back at us will be inverted.
Now one imagines that the string is instead tied to a heavier string which continues on into the distance. This is animated in Figure 8, with the heavier string being to the right of the vertical line. Something similar occurs, because as the wave meets the heavy string, an inverted, reflected pulse will again be formed. Meanwhile, some of the wave’s energy will continue forward, causing a more slowly moving wave along the heavier string.

If the pulse is initially moving along a heavier string which is tied to a lighter one, we will still have transmission at the boundary, with much of the energy continuing to move in the original direction. And again, some fraction will be reflected back, but this time, the reflected pulse will not be inverted. This is animated in Figure 9. Here, the incoming pulse reaches the boundary and encounters no downward reaction force from a massive wall or string, as it did with the previous two animations. Instead the lighter string at the junction simply rises up easily and falls back, sending new pulses forward and backward.
Having a feel for what pulses will do, let’s examine what happens at the junction of two strings when a sinusoidal wave comes along from the left. In Figure 10, we show the case of a black, lighter string attached to a green, heavier string, at a point again marked with a vertical line. For this example, the right side material is 50% heavier and thus slower. An incident wave (blue) comes from the left, creating a reflected wave (red) moving back, with a transmitted wave (green) continuing on. The resulting shape on the left side (black) is the sum of the incident and reflected waves. Note that the reflected wave is inverted relative to the incident wave at the boundary: when one has positive amplitude, the other is negative, and vice versa. This is consistent with Figure 8.
Figure 10. Simulation of a sinusoidal wave on a lighter string (left) meeting the boundary with a heavier string (right).
Something else to note is the relationship of wavelength, frequency, and speed. If we pick any one point on the string and count how often it moves up, down, and back up, we will get the same answer everywhere. That is, the wave frequency does not change for light vs. heavy strings, or for incoming vs. reflected waves. Yet, the speed of the wave on the right is markedly slower. The only way this can work is if the wavelength (the distance from crest to crest) on the right side is proportionally shorter. This is all captured by the fact that the speed is equal to the frequency times the wavelength.
If we reverse the situation so that the left side is the slower medium and the right side the faster one, the reflected wave is no longer inverted at the boundary, as the animation in Figure 11 shows. This is consistent with Figure 9, where we had a single pulse.
Figure 11. Simulation of a sinusoidal wave on a heavier string (left) meeting the boundary with a lighter string (right).
Here is another way to think about why the reflected wave is not inverted in this case, but was in the previous one: it is necessary in order to satisfy the boundary conditions where the light and heavy strings join. And the boundary conditions are simply this: the string must stay continuous, and it must keep a smooth shape. The first restriction is obvious, because the strings must stay tied together for this to work at all. The second restriction comes from the fact that the disturbance cannot change instantly in space, which would result in a sharp kink that isn’t physical. The fact that the wavelengths are different on the two sides means that the incoming and reflected waves have to add up in such a way that their sum connects in a smooth way with the transmitted wave. Try drawing a few examples and you will quickly see that in one case, it necessitates adding an inverted wave, in the other case a non-inverted one.
Instead of saying that the reflected wave of Figure 11 is non-inverted, we can also say it has no phase shift. When the incoming (blue) wave has a crest at the boundary, so does the reflected (red) one. For the case of Figure 10, we would say that the reflected wave is shifted in phase by 180 degrees, or by half a cycle, or by half a wavelength. This is seen by noting that if you slide a wave forward by half its wavelength, it is the same as if you’d merely flipped it upside-down. So, we have established two different cases of phase shift upon reflection: either zero or 180 degrees, and which one obtains depends on the way in which the speed changes at the boundary.
In order to anticipate an important result for light that we will get to shortly, let’s consider a third example of string motion, something contrived and unusual, but useful to imagine. Suppose we still have a heavy string on the left tied to a lighter one on the right, but now the lighter string is also immersed in a thick fluid. The resistive force, or drag, caused by the fluid will impede the string’s motion. The string must yet join up smoothly with the other one at the boundary, and so there will be much vertical movement there, but the further to the right we go, the more the movement will be damped, or attenuated, because of the resistance of the fluid. The motion will eventually die out altogether as we continue to pan to the right. The shape of the string will be an exponential decay in this region, but we will still need the same boundary conditions as before. Figure 12 shows an example of the motion that will result.
Figure 12. Simulation of an incident wave meeting a boundary at which the transmitted disturbance is damped away in an exponential fashion. All of the wave energy is reflected and there is a non-trivial (neither 0- nor 180-degree) phase shift.
Here, the reflected amplitude is identical to the incident amplitude (there is total reflection). This must be so since the disturbance cannot move to the right indefinitely, and all that incident energy has to come back from whence it came. Also, the phase shift (which corresponds to the place where the red and blue curves are always crossed) is neither zero nor 180 degrees; here it is something more like an eighth of a wavelength. Its specific value will come as a consequence of the string needing to maintain a continuous and smooth shape. By changing the degree of the “damping” we can alter the shape on the right side and at the boundary, thereby dictating the amount of phase shift that has to occur. A case with much less damping is shown in Figure 13. We see that the exponential decay extends further to the right than in the previous case, and as a result, the difference in phase for the reflected wave is almost zero. Something very similar will occur with light under TIR, but the shift will depend upon the angle at which the light impinges on the boundary, and its polarization.

The TIR phase shift
Let’s now imagine that we direct the beam from a laser perpendicularly onto a thick pane of glass. The animation in Figure 10 would be just as applicable, but now the waves are changes in the strength of the electric field in a transverse direction (that is, perpendicular to the direction of motion). On the left side the wave moves rapidly, and on the right side it is slowed down by the presence of the glass. Most of the light is transmitted, but some reflects back, just as you see yourself reflected in a window when looking outside at night from a well-lit interior.
The situation in Figure 11 also has an optical analogue, and would correspond to what happens when the light reaches the other side of the glass pane. Here it will partially reflect back with no phase change, while most of the light will continue on, into the air beyond.
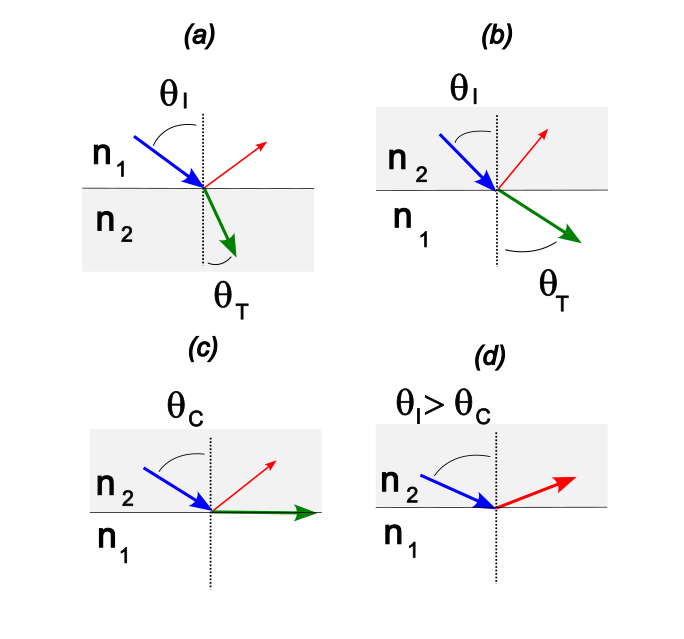
Neither of these scenarios interest us here. Instead, we want to consider what happens when light moving in a slow medium such as glass comes to a boundary with a faster medium, such as air, but at a large angle, for this is what happens within a reflecting prism. Why this is interesting can be seen from a graphical accounting of Snell’s Law, which governs the refraction, or bending, of light at a boundary. Various cases are shown in Figure 14.
Here,  is the angle of incidence and
  the angle of transmission. Snell’s Law connects these two angles and the indices of refraction according to
  . (These refractive indices capture how much the light is slowed by the medium, according to
  . For air, the speed of light is barely reduced from what it would be in a vacuum, so
  is very nearly equal to 1.0. In a glass with
  it is 50% slower.) In (a) we have a situation such as incident light (blue) coming from air into water or glass, where some is reflected (red) and the rest transmitted (green). This gives rise to the familiar “bent” shape of immersed objects. In (b) we have the reverse case, and we note that now, the transmitted angle must be larger than the incident one. In (c) we take this idea to the natural conclusion: there must be some incidence angle at which the transmitted light moves off parallel to the boundary: the critical angle,
  . In (d) we exceed this angle, resulting in TIR. There is nowhere for the light to go off to below the boundary, so it all gets reflected.
It is easy to (mistakenly) imagine that TIR involves an electromagnetic wave perfectly bouncing off a boundary without any penetration, like a rubber ball off the floor. But that is simply not possible, because the electric (and magnetic) field cannot be non-zero on one side of the boundary and then totally vanish on the other. These fields are a kind of continuous media that cannot be “kinked” any more than the vibrating string could. The sleight-of-hand that nature employs here is that there will be a non-zero field on the air side, but it will not involve any waves carrying energy away.
What happens in TIR, then, is similar to what occurred with the contrived string example where we introduced the “damping” of a thick fluid. The strength of the electric field on the far side of the boundary will roll off with an exponential shape. Energy cannot be carried away on this side, so it all is reflected. But in order to keep the field changing smoothly across the boundary, the reflected wave must have the appropriate phase shift, making the total field on the glass side, which is the sum of two sine waves, smoothly connect with the field on the air side, which is an exponential decay.
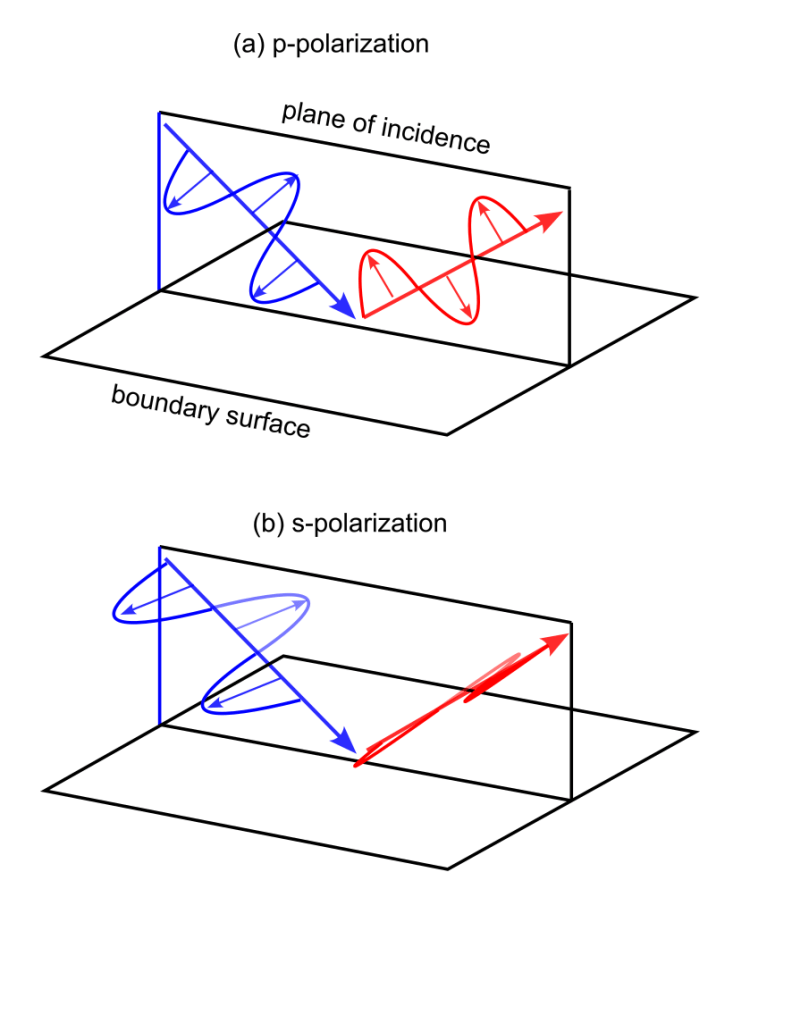
The specific shape of the exponential, that is, how “fast” it decays (refer back to Figures 12 and 13), depends on two factors: the angle of incidence and the polarization. We know what the former is, thanks to Figure 14. Polarization refers to the orientation of the electric field relative to the surface. An illustration such as in Figure 15 makes this easier to grasp. The large arrows show the incident (blue) and reflected (red) directions, and the small arrows the direction of the oscillating electric field. In (a) the field is confined to the plane of incidence, a condition called “p-polarization.” In (b), the field always points in a direction parallel to the boundary surface, making for “s-polarization.” (We could also have something in between, sticking out of incidence plane at some angle, but that is the same as having some combination of each of these two exclusive cases.)
So now we are left to ask how and why the exponential decay of the electric field will depend upon the angle and the polarization. First we will show the how and then get to the why. In Figure 16 we plot phase shift versus angle of incidence for the two polarizations, as well as the difference between these two curves (black). The curves are based on a typical glass/air interface. The critical angle is about 42 degrees; below this there is no TIR. The p-polarized case (red) always results in a larger shift than the s-polarized case (blue), except at the endpoints, where they are both either 0 or 180 degrees. (To derive the full expressions for these curves, we must write down the governing equations for the electric and magnetic fields (Maxwell’s equations) at the boundary and assign a sinusoidal character to the incoming wave. This also leads to the Fresnel equations for reflectance and transmittance.)

Let’s look first at the angle dependence for the s-polarization because the behavior of the electric field is simpler. In Figure 17 we illustrate the case of incidence at less than the critical angle, so that no TIR occurs. The animation shows the wave fronts, the lines of constant amplitude in the field, which have a purely sinusoidal dependence in both regions (glass above, air below), with the waves moving left to right in both media, but more horizontally in the air region.
In Figure 18 we have the case of just exceeding the critical angle, where the wavefronts in the air region must eventually decay to nothing. When we were below the critical angle, we had wavefronts extending to negative infinity, so it is reasonable that just as we transition into an exponential decay, it will be a long one, and it will meet the boundary with a very low slope, similar to that in Figure 13. This means that little phase shift in the reflected wave is needed to ensure that the total electric field changes smoothly across the boundary. Hence at the critical angle, the phase shift should be zero, and it is.
As the incidence angle increases, the light has less momentum in the downward direction, so less penetration into the air is expected. The exponential decay in the field must then roll-off faster, which means it meets the boundary with a more substantial negative slope. As the angle increases, the penetration into the air will get ever shallower and the phase must shift more so as to keep the boundary conditions satisfied. Hence the constant increase in phase shift as seen in Figure 16.
For the p-polarized light, we see that it begins and ends with the same limiting values (from zero to 180 degree shift), but that in between, it always generates a larger phase shift than did the s-polarized light. The reason for this is tied to the atomic-level response of the glass to the light, which we have been able to ignore up to this point. Not anymore! We need to make a short digression to cover this, but it will immediately lead to the cause of the larger phase shift.
A material such as glass effectively slows down the passage of light by virtue of the polarizability of its constituent atoms. The changing electric field of the light causes the distribution of bound charges to oscillate in response, taking in some of the incident energy and re-releasing it, with the net effect of a slowed version of the wave, a shorter wavelength, and often a shifted propagation direction. We can think of the material consisting of nominally spherical atoms, which under the influence of the field become extended ellipsoids, with the negative charge more directed to one end and the positive to the other. This is what we mean by the material being polarizable. Now we need to think about what the cumulative effect of this is, both within the volume of the glass and at its surface.
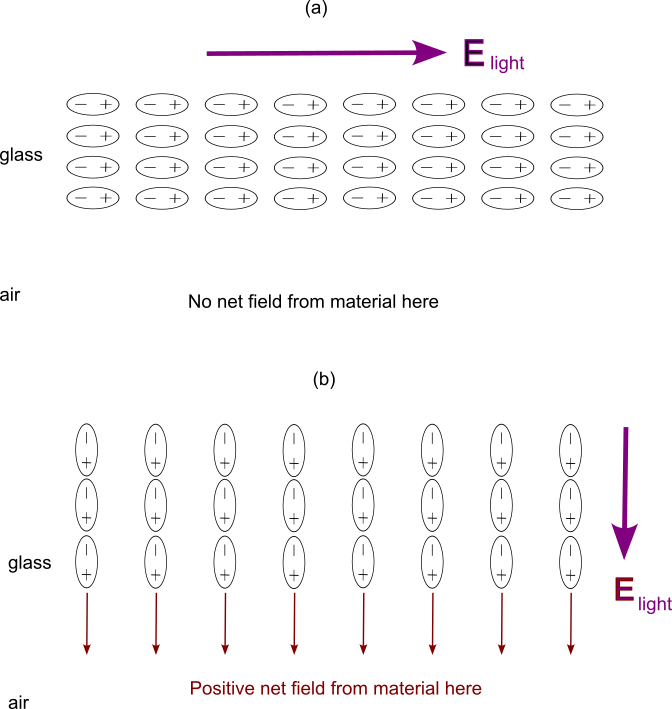
Figure 19 (a) shows a schematic of the polarization when the electric field of the light is in the s-polarization direction. If we look within the volume, we don’t see any net charge clumping up anywhere, as the positive end of one polarized atom effectively cancels out the negative end of its neighbor, and so on. In this case, if we were situated just under the boundary, on the air side, we wouldn’t notice any effect from these oscillating dipoles. But in (b), we have p-polarization, and the light’s electric field points up and down. At the surface, the last polar atom doesn’t have a neighbor to cancel it out. The boundary will now look like a big sheet of charge that toggles back and forth, positive to negative. This is something that could not occur in the previous situation. This boosts the strength of the local electric field on the air side, making the roll-off steeper, and so requiring a bigger phase shift on the glass side to make for a smooth transition across the boundary.
This difference is important to the degree that the incident light at the barrier has a component that is propagating perpendicular to it. That is, as the light becomes more glancing, as the incidence angle approaches 90 degrees, the exponential decay length becomes shorter and shorter, regardless of the polarization state. We therefore expect that the difference in phase for a more glancing angle must tend towards zero.
That’s all there is to the phase shift. It is a consequence of the nature of the electromagnetic field, how it is affected by boundaries, and how the boundaries are in turn affected by the field. There is a beautiful kind of symbiotic effect here, although what it leads to when it degrades performance in a roof prism is not considered beautiful. It should also be stressed that if you really want to get an intuitive feel for what is happening to at the glass/air boundary during TIR, you simply have to work through a derivation of the Fresnel equations step by step. It isn’t terribly difficult, and it is especially helpful in that you can plot out various dependencies as you go.
Now we need to look at how this is going to affect roof prisms specifically. We’ve done the easy part. The next step is where it gets really messy.