
Phase shifts and interference
The previous post introduced the topic of roof prism performance loss resulting from phase shifts that accompany total internal reflection (TIR). These shifts are endemic to TIR and to any device that employs it, including not only roof but Porro prisms. But in the latter case, the shifts have no deleterious effect on the image. The unique roof prism construction is therefore a necessary part of the problem. Only by tracing the paths that light takes through these devices can one see how phase shifts and prism geometry can together conspire to degrade image quality.
Porro prisms are not affected because all of the passing light undergoes the same net shift in phase. This does not present an issue as it has no detectable effect. It is by only by shifting some of the light, relative to the rest, in which something noticeable happens. This is a consequence of linear superposition, i.e., the fact that waves add together. Take two identical waves with the same amplitude A (corresponding, say, to the vertical height of a string) and add them, and you’ll get a result with amplitude 2A; this is constructive interference. But phase shift one wave relative to the other before you sum them and you’ll get a wave with amplitude less than 2A. For the case of a half-wavelength shift, the amplitude adds to zero and the waves cancel out in perfect destructive interference. (This will be animated in Figure 9 below.)
When light enters a roof prism, it is cleaved into two portions that follow different routes before being recombined, and the two routes may accrue phase changes in different ways. Some amount of destructive interference can result from this, reducing the overall intensity of the transmitted light and causing a loss in resolution, which we will get to in the following post. Our goal here is only to trace through the passage of light and understand just how convoluted the entire process is. We will do this with a series of diagrams and animations that are schematic in nature; attempting to explicitly depict all of the sinusoidal plane waves careening about inside the prism would be a fool’s errand. What will hopefully become clear is how the conditions are ripe for light to undergo destructive interference, and why so much of the math in the technical treatment is dedicated to tracking the convoluted process of multiple reflections.
The subtleties of roof prism geometry
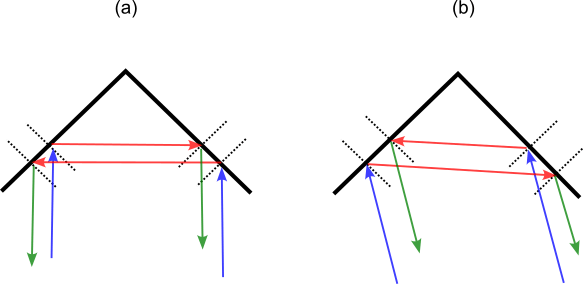
That the two paths through the prism could affect light differently is not obvious. In fact, the symmetry of the device would seem to preclude the idea at first glance. For example, as we begin to think about the problem, we might sketch a simple diagram such as that in Figure 1(a). Here, light falling perpendicularly onto the two reflecting surfaces would seem to be treated equally since all four incidence angles are the same. We might conclude that we have oversimplified this, since some light comes in from off-axis as well, as shown in (b). But when tracing through this geometry, we’ll see that both sides undergo reflections at the same two angles, just in different order, which seems like it shouldn’t matter.
To see what is breaking the symmetry requires looking more closely and recognizing that we’ll have to deal with the polarization of the light, which is to say, the electric field orientation. Each photon, or individual unit of light, amounts to a localized wave in the electric field; a wave that must be oriented at some angle perpendicular to the direction that the light travels. When we have light as a whole that is unpolarized, as is very often the case, it is only because it has no net polarization on average. It is still ultimately composed of photons that are each polarized. So we need to reckon with polarized light before we can do anything with the unpolarized case.
Suppose we start with a laser source, where the beam will feature a single wavelength and will be polarized. We split this into two parallel rays that enter a roof prism oriented such that the roof line makes a 45 degree angle to the light, as shown in Figure 2(a). We will suppose that the light is polarized vertically, with the electric field pointing down as it approaches the surfaces, as shown by the purple arrows in (b). The field is of course oscillating, and pointing up and down as a function of position and time. However it is going to make life much simpler if we simply specify one direction. We will refer to the two sides, and the two beams, as the left and right portions, corresponding to first surface struck from the perspective of the light source, as shown in (c). This point of view will be referred to simply as our reference frame. The vertical direction corresponds to the z-axis, the rightward horizontal direction is the x-axis, and the propagation direction of the initial light is into the screen (or paper), along the y-axis.
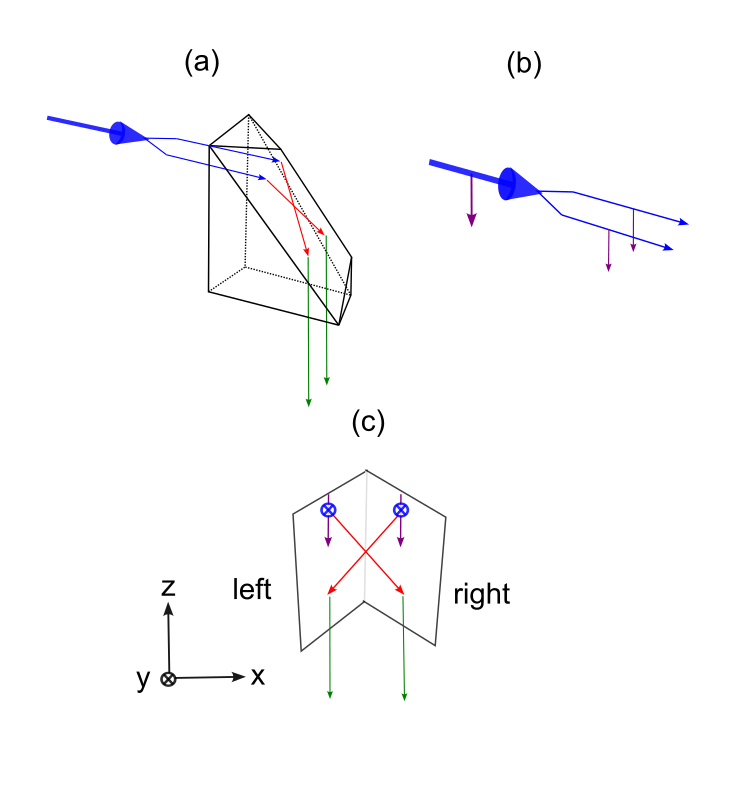
If the prism were standing up straight so that the roof line was perpendicular to the light (imagine rotating the prism in 2(a) clockwise by 45 degrees), then the two rays would clearly strike their respective sides at 45 degree angles, relative to a “normal” or imaginary perpendicular line that sticks out of each face, as in (a). But with the prism orientated as shown, the angle of first incidence (where blue arrows meet red arrows) must be even steeper: it is 60 degrees relative to the normal direction. Upon reflection, the light moves off at 60 degrees, and will then strike the other surface (where red arrows meet green) at the same angle. Meanwhile the other ray takes a route that is a mirror image of this path. Attempting to depict all of this using two dimensional images is not easy, so we will resort to animations that change perspective in order to help visualize what is going on. Figure 3 shows the two interior sides of the roof and the two incoming rays in blue, their first reflections in red, and the exiting rays in green. The total deviation is 90 degrees for both, and they enter parallel and leave parallel. The purple arrows indicate the orientation of the electric field that we are assuming for the incoming light.

Tracing the passage of light
Let’s step back and recall what our task is now that we have a feel for the geometry. In the previous post, we saw that the phase shifts were dependent on the incidence angle and the polarization of the incoming light relative to the surface. The incidence angles are easy: all four reflections will all occur at 60 degrees relative to surface perpendiculars. It is the matter of polarization which is going to make a mess of this situation. Although we have chosen a simple starting condition, with vertical polarization in the frame of reference shown in Figure 2(c), the perspective from the point-of-view of the surfaces is quite different (and far more important). The polarization arrows in Figure 3 point neither in the s- nor p-polarization directions, but rather contain components in these directions. We will need to have a very clear picture of all of this before we can talk about phase shifts. Because we are going to be breaking up these vectors into smaller components, we need to also be aware that their lengths correspond to the strength of the electric field, which determines the intensity of the light, which will be proportional to the square of the field.
In Figure 4, we depict the incidence of the light schematically, by showing the polarization vectors approaching the prism surfaces. Each of these vectors is then resolved into two components, which correspond to the s- and p-polarization directions for the two surfaces. Note that while the original purple arrows were identical and parallel, none of the components are. The broken symmetry is apparent now. Keep in mind that nothing about the incident electric field has been changed; rather, we have two different frames of reference in which we must to describe it.

When we resolved the electric field into these components, they are shown “attached” to the same point along the blue arrows, which indicate the direction of the propagation. This is a useful way to show the phase relationship of these two components – here they are perfectly in phase as they arrive at the surfaces. The purple arrows correspond to the location of the maximum field, which is of course changing in a sinusoidal manner in both time and space. Compare diagrams (a) and (b) in Figure 5 to see how the components in Figure 4 represent this phase information.

Upon reflection, we know that the p-component will acquire a larger phase shift than the s-component. Diagrams (c) and (d) in Figure 5 show how these waves will then become staggered and how our simplified representation will capture this. When this happens to light, the result is elliptical polarization, which means that the electric field vector will not oscillate back and forth, but will trace out the shape of an ellipse. We will show how this occurs in more detail below. For now, we will simply consider the phase lag using displaced arrows, as shown in our next animation, Figure 6, which captures what happens upon reflection. The p-components, which can be seen to lie in a plane defined by the red and blue arrows, will precede the s-components, which are always parallel to their respective surfaces. Keep in mind this is merely our way of tracking the relative phase change between these components.
The p-vectors are seen to shift as they “go around the corner.” But they are in fact merely staying in the same plane: imagine holding a sheet of paper such that both the red and blue vectors for a given path lie on it. The p-component always remains in this plane, pointing perpendicular to the propagation direction. The lengths of all these vectors have not changed, but the difference in phase is about 11% of a wavelength, with the p- leading the s-component.
It would be convenient if these shifted components came out of their first reflections such that they were already in the s- and p-directions corresponding to the next set of reflections. Alas, they are not. Each of the four polarization vectors from Figure 6 must now be resolved into new components prior to the upcoming reflections. We will perform the same kind of step as we did in Figure 4, but now with four vectors being resolved into eight, as animated in Figure 7.
The bookkeeping needed to track all this is obviously going to get involved, because we need to take components of the components. (This is why the approach in the technical article is so much more attractive than doing this “by hand.” The methods used there take care of all of these components in a more compact and elegant manner.)
Before looking at the next animation, it should be clear what we expect to see. Light that was p-polarized after the first reflection is now resolved into both s- and p-components for the second reflection, which will cause them to get shifted. The s-components from the first reflection, following behind, will also get split. As the rays finally come out of the prism, each one can be seen as consisting of four components. This is shown in Figure 8. Again, there is no change to the vector lengths (so no change to the electric field strengths that they represent), but new phase shifts will need to be accounted for. We now will have the leading vector trailed by the next two, and a last one an equal distance back.
Finally, with all the reflections completed, we will have to add together everything that was taken apart. We first note that for each path, there are two pairs of electric field vectors which are are parallel (or anti-parallel) to one another, but which differ in phase. To add these up we must keep in mind that we are not simply adding vectors, but sine waves that are shifted relative to one another (remember Figure 5). The result of doing so produces another sine wave with a new amplitude and phase. Examples of adding shifted sine waves are shown in Figure 9, for the cases of equal and unequal amplitudes. The waves to be added are in red and blue in the top row, while the bottom row curves in black show the results from summing them together. On the left side we have the special case of equal amplitudes, and we see the full range of constructive and destructive interference. But when the amplitudes are unequal, as on the right side, the summation is more involved, and we will obtain a sine wave with an amplitude dependent upon the relative phase. The phase of this resultant wave will also be affected. No matter what, the amplitude of the final wave can never be any larger than the sum of the two starting amplitudes.

For each path, we will combine the two s-components and the two p-components based on the addition rule illustrated by Figure 9. This will leave us with two set of shifted components for each path. The last step will be to add up these results, but this is not trivial either, because none of the vectors are parallel to one another. We will need to express the vectors for one of these paths in the coordinate system of the other path before we can sum them. This means we will be adding staggered sine waves again, and there will be another opportunity for some phase interference.
It should be pointed out that if there were no phase shift upon reflection, then everything would add back together perfectly. The great mess made by taking components of components will be perfectly reversed when they are all added back together. But the existence of the phase shifts throws a wrench into it all, providing an opportunity for destructive interference to get in and attenuate the total amount of light that escapes.
Keep in mind that as complicated as this all is, we have only looked at the simple case of a single polarization direction – and a symmetrical one that was relatively easy to track. If we want to consider unpolarized light, we need to repeat this for all other polarization orientations and add up the results. Luckily, integral calculus makes such computations straightforward, but formulating the problem correctly takes much care. The bulk of the technical article involves just setting up the integrations, and the calculus that comes on the heels of that is actually rather trivial.
Elliptical Polarization
Before we consider the impact on the resolution, we’ll look at the problem in the context of elliptical polarization, as alluded to above. This may help make the effects of the roof prism geometry and phase shifts more clear. Essentially, we are merely adding the time-dependent character of the oscillating electric field to the vector illustrations developed above.
Elliptical polarization is the general result which occurs when the s- and p-components acquire different phase shifts, and generally results whenever light that is linearly or elliptically polarized undergoes TIR. It will be helpful if we first construct some animations showing the differences between these types of polarization.
Figure 10 shows four examples of how the electric field can vary over time, as seen from the perspective in which the light is heading out (or into) the screen . Red and blue are used to denote the perpendicular components (corresponding to s- and p-polarizations), with the sum being shown in black. At the top left we have linearly polarized light, which is equivalent to elliptical polarization with zero phase offset. As the phase offset is increased, the lag between the two components causes the sum to trace out an elliptical path that becomes more obvious as the phase is increased. When the phase offset is a quarter of a wave, or 90 degrees, the polarization is perfectly circular.

From here on, we can drop the animation of the electric field tracing out the shape, and simply draw the resulting ellipse. What we wish to first consider is simple case of a single reflection. When a linearly polarized beam undergoes TIR, the exact elliptical polarization that will be produced depends on the orientation of the polarization relative to the surface. Consider that if the incoming light happened to be fully in the s- or p-direction, we would have to get linearly polarized light as a result – there would be no “splitting” of the beam into components. For all other cases, there is some amount of each component present, and the phase shifts will make themselves obvious via an ellipse.
Figure 11 shows the relationship between the incoming polarization orientation (black, left) and the resulting reflected, elliptically polarized light (blue, right), for a single TIR event. Keep in mind what we are looking at in both cases is the path traced out by the electric field as seen along the direction of propagation. The animation is simply sweeping though the different ways in which the linearly polarized light could approach the surface, and the corresponding polarization of the reflection.
The situation will become more involved when we wish to express the polarization of the incoming light in a reference frame that is not coincident with that of the surface. For example, let’s consider the same situation as in Figures 4 and 6, with linearly polarized light approaching the surfaces of the Amici prism. For those two figures, we always had the initial polarization oriented vertically. In Figure 12 below, we let the orientation of the incoming light vary, shown in the center with the black line, so we can see how the elliptical polarizations produced by the two surfaces respond. They are shown relative to their own native reference frames by the red and blue curves on either side. When the black line is vertical, we are seeing the same situation that was illustrated in Figure 6 above.

As a general rule, it is not easy to look at a roof prism (which will include additional reflecting surfaces besides those on either side of the roof line) and intuit exactly what the outgoing polarization states will look like as a function of the incoming linear polarization. Each of the elliptically polarized beams in Figure 12 comes from just a single reflection, and the light must yet splash off other surfaces, leading to more rotations of the ellipses and further phase shifting. The results for the full Amici prism (two reflections for each side) are shown in Figure 13 below, where the two “output” polarizations are displayed relative to the native frame of reference for the light exiting the prism. When the black line is vertical, this corresponds to the emerging light in Figure 8 above. The green curve in the center is the full output, consisting of the two half-beams added together.
What should be clear is that the two roof surfaces, together with the phase shift, are going to affect the two light paths differently. Depending on the details, when the light is finally added, the phase misalignments may result in some amount of destructive interference and attenuation of the light that is transmitted. That is captured by the green ellipse in the center, which represents what is traced out by the vector sum of the left and right beams. This is plotted to scale, and the fact that is shows less amplitude than the incoming light captures a key deleterious effect we are aiming to demonstrate. Such an addition is valid when the incoming light is coherent, which will be true for some cases, but not for others. In observing light from a point or slit source, for example, this effect will be important, We will see this in the following section when we look at that situation in more detail.
We’ve been looking at polarized light entering the prism. Normally we will encounter much unpolarized light, but because it can be treated as an ensemble of linear polarizations with a uniform distribution of orientations, it will suffer from the same problems. And the key upshot from all of this is that these phase shifts accumulated by the roof surfaces may negatively affect the spatial resolution when light from a point source or a thin slit is passed through the prism. In the next post we will look at how this loss in resolution comes about. We’ll also look at how the judicious use of dielectric coatings can mitigate the problem.
Hopefully the reader is now impressed with the complexity of tracking the course of light through even the simplest roof prism. This is why it is far more convenient to describe the orientations of the various surfaces and work through a series of reference frame rotations and phase shifts by using Jones matrices, as is done in the technical paper. Keep in mind that for binocular prisms, unlike the Amici, there will be at least one total internal reflection before the roof surfaces are reached, and there may be multiple reflections after. In a later post, we will look through some special cases of the full prism geometry in order to demonstrate how the use of crossed polarizers can be used to reveal if the roof surfaces have been coated or not.