
Edit: I used to be a huge supporter of eBird, both in terms of promoting it and through financial support of Cornell. This is no longer the case. I think eBird has had bad effects on birding, as detailed here. The Cornell Lab of Ornithology has also thrown their support behind this misguided decisions of the AOS to rename birds for nakedly political reasons, as covered here and here.
The eBird site administered by the Cornell Lab of Ornithology was launched in 2002 and has arguably advanced birding more than any technology since binoculars. Beyond acting as a repository for one’s records, it affords many tools to explore the data submitted by tens of thousands of birders, while giving ornithologists an ever-growing data set that has no peer in other biological sciences.
Analyses of eBird data has so far tended to focus on distributions and migrational movements. But it can also give insights into the engagement of birders. Of interest here is the data from the “Top 100” page, which provides a snapshot of the efforts of the most active participants, and which can be tailored for specific geographical areas and/or time frames. For example, one can look at the highest total number of species reported, or lists submitted, for any year, and for any geographic region. With a goal of recording at least 2,500 species in 2018 while working full-time, a study of the Top 100 records seemed instructive. Specifically, records for the past 30 years were analyzed, with a focus on the maximum number of species (as opposed to maximum number of lists) for worldwide birding.
Consider the total number of species reported vs. year, as shown in Figure 1. The bright green points at 2002 indicate the start of eBird; the bluish data to the left consists of historical records that had to be entered by users at a later time, while the reddish data to the right features data added more in ‘real-time.’ Note that the 2015 record Big Year (6,042) of Noah Stryker is not shown here – it was removed as it is such a huge outlier – both statistically and in terms of the typical effort given by even the most prolific eBirders. Also, a word about the data for 2017: because the Top 100 data was queried on November 24, 2017, it represented an incomplete year – the specific values here for 2017 are an extrapolation of the counts as of late November, out through the rest of the year.

We see a clear, increasing trend in the number of species seen by the Top 100. In 1986, someone recording 1,000 species would have been the third most prolific eBirder, but in 2017, they would not even get into the Top 100. Also, after about 2005, there is a divergence in the average slopes of the top and bottom of the envelope of data – even as those in the lower portions of the Top 100 list are recording more birds every year, the handful of individuals within the top five or so are pushing the species totals up at an even faster rate. This almost certainly reflects a wider range of birding locales being explored.
A natural question at this point involves the makeup of the eBirding community reflected in this plot. The data was analyzed in terms of the number of years in which each individual appeared in these 30 Top 100 lists. There were a total of 22 eBirders that have been in the Top 100 sixteen or more times. Results for these 22 individuals alone are shown in Figure 2. Colors correspond to different eBirders.

Figure 2 illustrates that the growing high species counts are not due to different, more prolific birders showing up more recently. Rather, it shows that the most continuously active eBirders are, on average, reporting more species every year.
Two other data sets were examined to see if trends were different. One set was based on highest species counts, but restricted to the United States only. The other set involved looking at the Top 100 worldwide, but using the total number of lists submitted instead of the species count as the determining factor for inclusion in the Top 100.
The median results for each case vs. year were determined and are shown in Figure 3. (The median captures an average sense of the Top 100 performance without being strongly influenced by any outliers.) The green line is for the original data set, where maximum species count is expected. The blue line is the same approach, but limited to the United States. The red line is for the case of highest numbers of lists, worldwide. Note that the blue curve does not include data for 2017 – it did not seem appropriate to extrapolate and project forward the numbers, given the lower ceiling on the total number of species possible in the USA as opposed to worldwide.
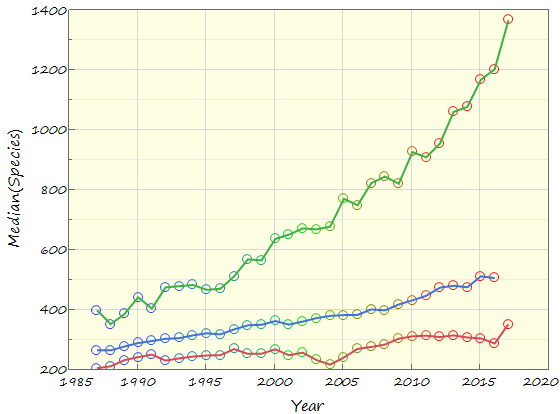
In both the worldwide and US-only data, the number of species is increasing. Obviously the US-only curve will eventually ‘hit a wall’ before the worldwide data will. Meanwhile, the slope for the worldwide data has been ticking up constantly.
One might expect that the number of submitted lists that correspond to these increasingly larger species counts would show a proportional change. Species and lists counts do trend together, but not always at the same rate. Figure 4 shows the median number of species vs. the median number of lists, with a spline fit applied to show the general trend. Below 100 lists, and above, there is a dramatic change in the slope.

Figure 5 shows the same plot, but for the US-only Top 100. The results are qualitatively identical to what is seen in the global data.

While in both cases, 100 lists roughly marks the inflection point, one should note the colors, which reflect the year: the change in slope occurs around 2005 in both cases. This suggests we look at the data for the median number of lists submitted vs. year, which is in Figure 6 below.

Clearly the changes in slope in Figures 4 and 5 are simply due to a very large increase in the median number of lists submitted by year, starting around 2005. This growth dramatically outpaces the increase in number of species reported. What caused the dramatic shifts in Figures 4 and 5? All of the data prior to 2002 had to be entered after-the-fact, often by hand, I imagine, and not everyone is going to be motivated to enter every note they had made in the field dating back x years. Maybe there was a tendency to consolidate lists? In any case, there is no question that among hard-core birders, there have been significantly more lists, and lists-per-species, on average, being submitted on a yearly basis since 2005. And this is true worldwide as well as in the US. Why didn’t the sudden shift in median number of lists submitted happen in 2002, when eBird began? It seems reasonable to suppose that it took several years for “word to get out” and for birders to realize the utility of this powerful resource.
These trends should please the creators of eBird; not only is the army of observers growing, the efforts made by the most prolific members are steadily increasing on a yearly basis, garnering not just more species but more lists, and accelerating the size of the data set. It would be expected that this holds regardless of whether one is in a top-100 list or not. There is no reason to expect the trends to change anytime soon, although they will reach some asymptotic limits eventually. When, and at what values? It will be interesting to watch and see. I plan to revisit this at the end of 2019, and include some Top 100 lists at the U.S. county level also, to look at eBird’s impact on the hardcore birders that religiously monitor a given area as ooposed to trotting the globe.